Hypothesis Testing
1. Explain hypothesis testing.
Hypothesis testing is used to make inferences about population parameters based on sample data. Formally, evaluates two mutually exclusive statements about a population to determine which statement is best supported by the sample data.
2. List the 5 main steps to perform hypothesis testing.
- State $H_0$ and $H_1$.
- Collect data in a way designed to test the hypothesis.
- Perform appropriate statistical test.
- Decide to reject or fail to reject $H_0$
- Present the findings and recommendations.
3. Explain null and alternative hypothesis.
- Null hypothesis: Claims that there is no difference or effect is expected. If the null hypothesis is not rejected, the conclusion remains the same.
- Alternate hypothesis: Claims that there is a difference. If the null hypothesis is rejected, it implies that this alternate hypothesis is correct.
4. Explain the level of significance $(a)$.
It is a threshold to determine statistical significance. $a$ dictates the strength of the evidence that must be present in your sample to reject the null hypothesis and conclude that the effect is statistically significant.
5. What does a lower level of significance $(a)$ implies?
The lower value of $a$, the stronger the evidence required to reject the null hypothesis.
6. The level of significance $(a)$ acts like a maximum risk of making false positive conclusions (Type-I Error). Elaborate the statement.
5% significance level indicates a 5% risk of concluding there is a difference when there is no actual difference. In other words, we accept the risk of rejecting the null hypothesis 5 out of 100 times even though we should not.*=
7. What are some factors we shoulder consider when determining the sample size?
- Significance level
- Margin of error
- Population size
8. Explain one-tailed test in terms of critical region.
In a one-tailed test, the critical region for rejecting the null hypothesis is located in one tail (either the left or the right) of the probability distribution.
9. Explain two-tailed test in terms of critical region.
In a two-tailed test, the critical region for rejecting the null hypothesis is divided between both tails (both the left and the right) of the probability distribution.
10. In what situations should we opt for a one-tailed test versus a two-tailed test?
- One-Tailed test: Test greater than or less than a certain value, but not both.
- Two tailed test: Tests whether a sample is both greater than and less than a certain range of values. In essence, to test whether there is any significant difference from the null hypothesis, regardless of the direction.
11. Explain $p$ value in the context of hypothesis testing.
$p$ value is the probability of observing an event or something else that is equal or rarer.
12. What does $p$ value quantify?
$p$ value quantifies the likelihood of obtaining the observed results from the sample if the null hypothesis is true for the population.
13. Explain $p$ value use-case in hypothesis testing.
$p$ value helps to determine whether to reject the null hypothesis.
14. How do you compare $p$ value with significance level $(a)$?
If the $p$ value is smaller than $a$, it implies that the sample results are not consistent with the null hypothesis, thus reject the null hypothesis and conclude that effect is statistically significant. Vice-Versa.
15. What does lower $p$ value imply? Provide the intuition behind the answer.
Lower $p$ value indicates greater evidence against the null hypothesis. Intuitively, a small $p$ value implies that the sample mean or sample proportion occurring is extremely rare if the null hypothesis is true, which strongly suggests that the actual population parameter is not what the null hypothesis states.
16. How does a low $p$ value relate to the likelihood of committing a Type 1 error?
A small p-value implies a low probability of obtaining the observed results if the null hypothesis is true, reducing the likelihood of making a Type I error.
17. When does Type-I error occur?
Type I Error occurs in hypothesis testing when the null hypothesis is incorrectly rejected when it is actually true.
18. Why is Type-I error also known as false positive?
It is also known as false positives because it involves a positive result (rejected the null hypothesis) that is falsely concluded.
19. What is the relationship between Type-I Error and significance level $(a)$.
$a$ is the maximum probability that we have a Type-I error. Thus Type-I errors can be controlled by changing the significance level.
20. When does Type-II error occur?
Type II error occurs in hypothesis testing when the alternate hypothesis is incorrectly rejected in favour of the null hypothesis when it is actually true.
21. Why is Type-II error also known as false negative?
It is also known as false negatives because it involves a negative result (failure to reject the null hypothesis) that is falsely concluded.
22. What is the probability of making a Type-II error?
The probability of making a Type-II error is $\beta$ in the power of test $(1-\beta)$.
23. What is the power of test?
$1- P(\text{Type II error})$ , which represents the probability of correctly rejecting the null hypothesis.
24. State the trade-off between Type-I error vs Type-II error. Explain the answer.
Decreasing the risk of Type-I error will usually lead to an increase in Type-II error. Intuitively, to reduce the probability of observing Type-I error, we decrease the significance level $(a)$. However, decreasing $a$ makes it harder to reject the null hypothesis, which increases the probability of incorrectly rejecting the alternate hypothesis and that corresponds to an increase in Type-II error.
25. Illustrate Type-I error and Type-2 error using probability distributions.
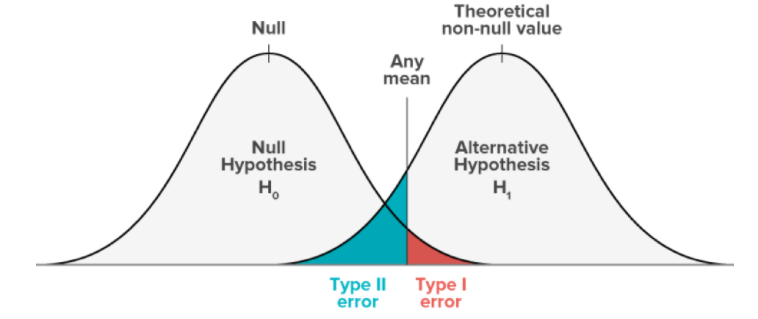
Image Source: https://medium.com/@saikatbhattacharya/model-evaluation-techniques-for-classification-models-eac30092c38b
- Type I error occurs when we incorrectly reject the null hypothesis when it is actually true.
- Type II error occurs when we incorrectly reject the alternate hypothesis when it is actually true.