Descriptive Statistics
1. Describe the purpose of descriptive statistics.
Central Tendencies
1. Describe the concept of the mean as a measure of central tendency, including the formula and its recommended application.
Definition: Mean is also known as the average. Mean is the sum of all values in a dataset divided by the number of observations
Formula: $\bar{x} = \frac{\sum x_i}{n}$
Use-Case: It is suitable for symmetrically distributed data without extreme outliers and and when each data point contributes equally to the central value.
2. Describe the concept of the median as a measure of central tendency, including the formula and its recommended application.
Definition: Median is a measure of central tendency that represents the middle value in a dataset when it is arranged in ascending or descending order.
Formula:
- Odd Number of Samples: $\frac{n+1}{2}$
- Even Number of Samples: $\frac{\frac{n}{2}+(\frac{n}{2}+1)}{2}$ (To split in the middle)
Use-Case: It is useful where the datasets contains extreme outliers or when the distribution is skewed. It provides a more robust measure of central tendency compared to the mean.
3. Describe the concept of the mode as a measure of central tendency, including the formula and its recommended application.
Definition: The mode is a measure of central tendency that represents the most frequently occurring value(s) in a dataset.
Formula: Select the value(s) with the highest frequency of occurrence.
Use-Case: It is useful for analysing categorical data, such as colours, types, or categories, where identifying the most common value is meaningful.
Dispersion and Shape
1. Define Range.
2. Explain Interquartile Range (IQR)
3. Explain the steps to calculate IQR.
- Calculate Quartiles:
- Arrange the dataset in ascending order.
- Find the median, which is Q2.
- Find Q1, which is the median of the lower half of the dataset (excluding Q2)
- Find Q3, which is the median of the upper half of the dataset (excluding Q2)
- Calculate IQR:
- IQR is the range between the Q1 and Q3.
- $IQR = Q3-Q1$
4. Illustrate a box-and-whisker plot and explain the use-case.
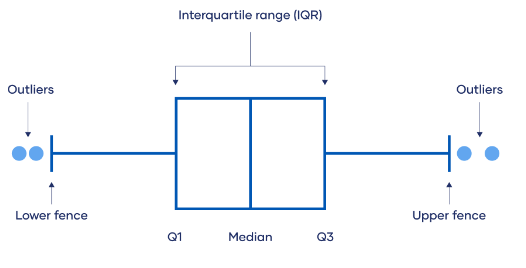
Image Source: https://www.scribbr.com/statistics/interquartile-range/
Box-and-whisker plots visualises the distribution of data, where the box represents the interquartile range, and the “whiskers” extend to the minimum and maximum values between the lower and upper fence (usually $\pm$ 1.5 times the IQR) to identify potential outliers.
5. Describe the concept of variance ($Var$), including the formula.
Definition: A measure of how spread out the values in a dataset are from the mean.
Formula: $Var= \frac{\sum_{i=1}^n(X_i-\bar{X})^2}{n}$
- $Var$: The variance.
- $n$: The total number of observations.
- $\bar{X}$: The mean.
- $X_i$: Represents each individual value in the dataset.
- $\sum$ denotes the sum of the squared differences between each value and the mean.
6. Describe the concept of standard deviation ($SD$), including the formula.
Definition: A measure of how spread out the values in a dataset are from the mean.
Formula: $SD = \sqrt{Var}$
- $SD$: The standard Deviation
- $Var$: Variance
7. Provide the two main objectives for squaring differences when calculating the variance.
- To ensure positivity: Squaring the differences ensures that all values are positive. Without squaring them, positive and negative differences might cancel each other out, resulting in a net difference of zero.
- Exaggerate larger deviations: Larger deviations are often considered more important in assessing the spread or variability of a dataset.
8. Why $SD$ is used more often than $Var$?
9. Why stating $SD$ in relation to the mean is important?
10. Describe the concept of mean absolute deviation $(MAD)$, including the formula.
Definition: A measure of the average absolute difference between each data point in a dataset and the mean of that dataset.
Formula: $MAD= \frac{\sum_{i=1}^n|X_i-\bar{X}|}{n}$
- $MAD$: The mean absolute deviation.
- $n$: The total number of observations.
- $\bar{X}$: The mean.
- $X_i$: Represents each individual value in the population.
- $\sum$ denotes the sum of the squared differences between each value and the mean.
11. Is it possible for the $SD$ to be less than $MAD?$
12. If the data is shifted, what will happen to the values of central tendencies (Mean and Median) and the values of dispersions ($Var$ and $SD)$?
13. If the data is scaled up, what will happen to the values of central tendencies (Mean and Median) and the values of dispersions ($Var$ and $SD)$?
14. Describe skewness, whether it’s to the left, right, or no skew, in terms of the relationship between the mean and median.
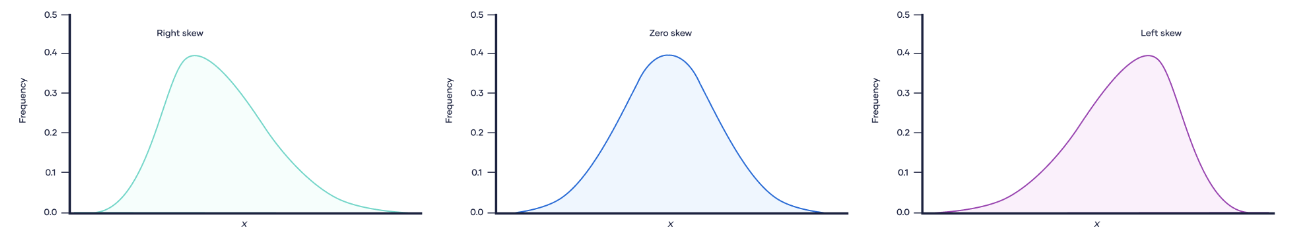
Image Source: https://www.scribbr.com/statistics/skewness/
- Right Skewed: Mean is greater than median. The right left tail pulls the mean in that direction.
- Left Skewed: Mean is less than median. The longer left tail pulls the mean in that direction.
- No Skew: Mean and median are approximately equal if the distribution is symmetrical.
15. Describe kurtosis, whether it is high or low, in terms of comparing against a normal distribution.
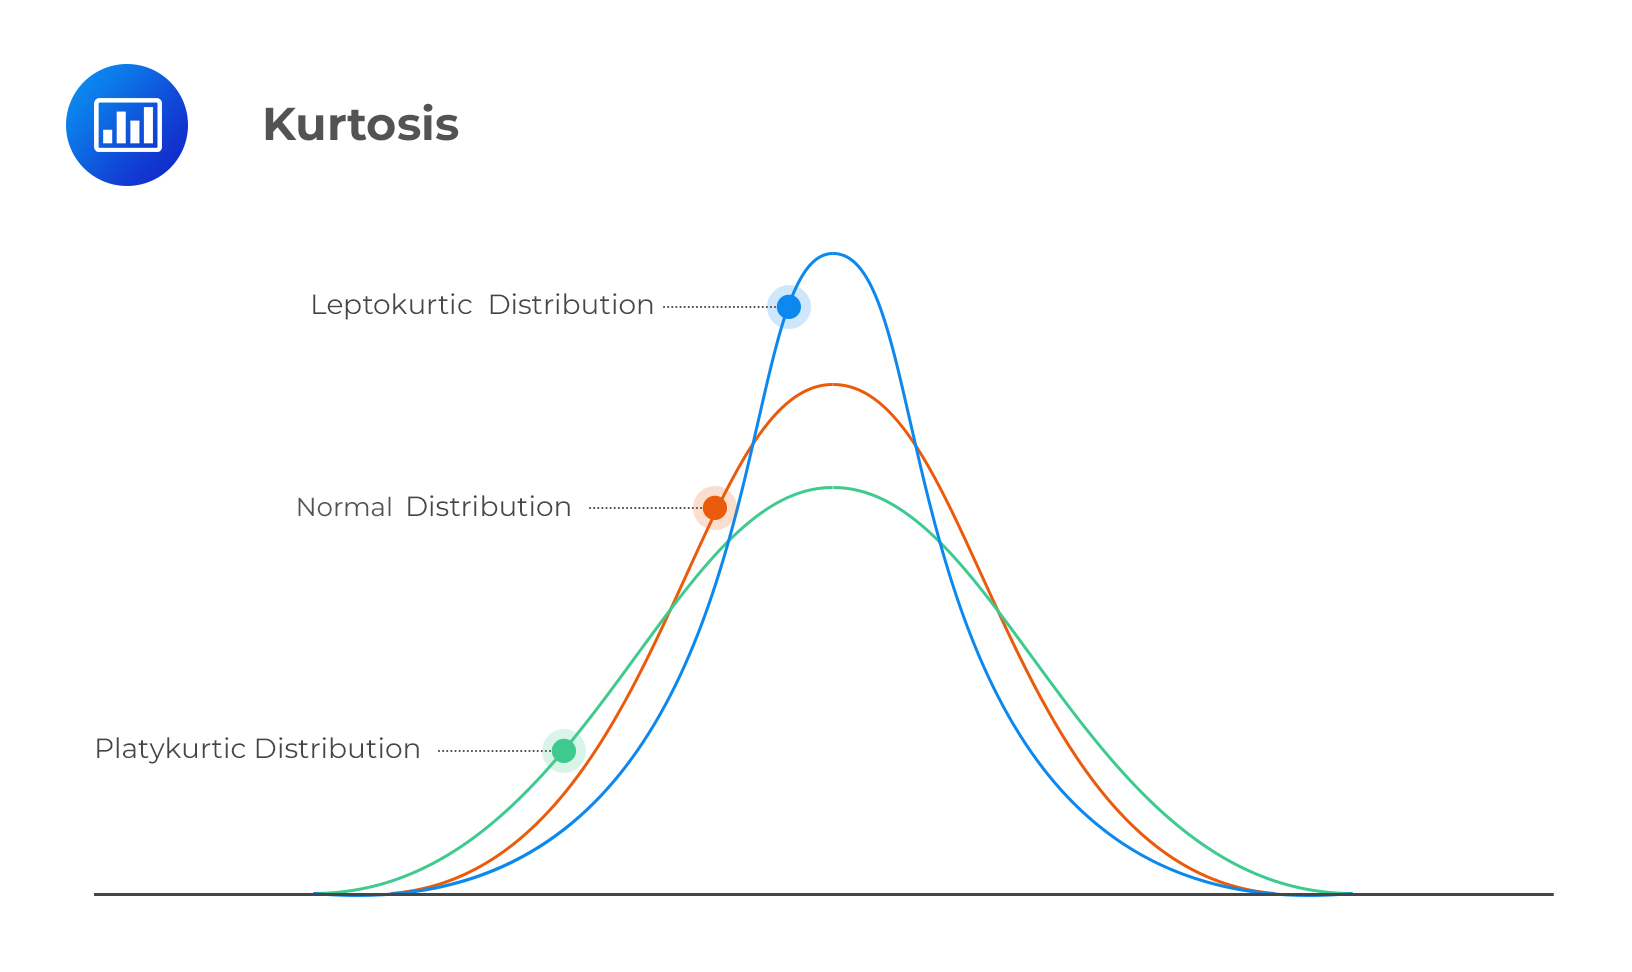
Image Source: https://analystprep.com/cfa-level-1-exam/quantitative-methods/kurtosis-and-skewness-types-of-distributions/
- High Kurtosis (Leptokurtic): Characterised by a higher peak and heavier tails compared to a normal distribution. This indicates that the data has more extreme values (outliers) and is more concentrated around the mean.
- Low kurtosis (Platykurtic): Characterised by a flatter peak and lighter tails than a normal distribution. This suggests that the data has fewer extreme values, and the values are more spread out from the mean.