Performance Metrics
Introduction
1. Explain the purpose of performance metric.
2. Explain the importance of using multiple metrics to evaluate the overall model performance.
3. Explain the purpose of the baseline score. Provide a baseline for both regression and classification.
The baseline score / baseline model is a simple model that provides a base level of performance to compare against more complex machine learning models. It is used for bench marking the additional value beyond what the simple approach can provide.
Examples:
- Classification: Predicts the most frequent class.
- Regression: Predicts a central tendency (mean, median, mode).
Regression
1. Provide the formula for Mean Square Error (MSE) and briefly describe when to best use the metric.
$$ MSE = \frac{1}{n}\sum (y_i-\hat{y_i})^2 $$
- Use MSE when you need to penalise large errors or for optimisation purposes.
2. Provide the formula for Root Mean Square Error (RMSE) and briefly describe when to best use the metric.
$$ RMSE = \sqrt{\frac{1}{n}\sum (y_i-\hat{y_i})^2} $$
- Use RMSE when you want to penalise large errors, but see it in the unit of the target, making it interpretable.
3. Provide the formulas for Mean absolute Error (MAE) and briefly describe when to best use the metric.
$$ MAE = \frac{1}{n}\sum |y_i-\hat{y_i}| $$
- Use MAE when all errors, large or small, have equal importance.
4. Provide the formulas for Max Error and briefly describe when to best use the metric.
$$ Max(y_i-\hat{y_i}) $$
- Use Max Error to identify and quantify the largest errors or outliers in your predictions
5. Define Sum of Squared Total (SST), Sum of Squared Regression (SSR) and Sum of Squared Error (SSE). Provide the formulas for each of them.
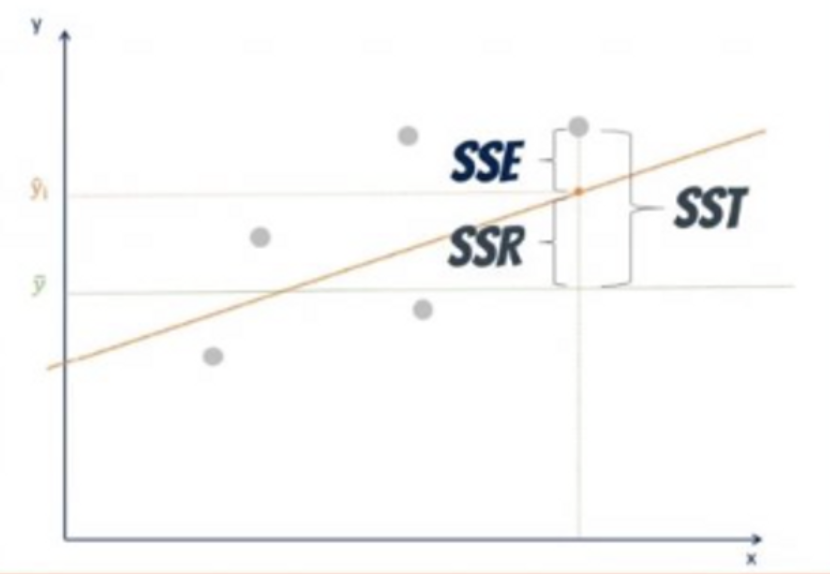
Image Source: https://365datascience.com/tutorials/statistics-tutorials/sum-squares/
- Sum of Squared Total: $SST = \sum (y_i-\bar{y})^2$ or $SST = SSR +SSE$
- SST measure the difference between actual dependent value against the mean dependent values
- Sum of Squared Regression: $SSR = \sum (\hat{y_i}-\bar{y})^2$
- SSR measures the predicted value against the mean dependent values.
- Sum of Squared Error: $SSE = \sum (y_i -\hat{y_i})^2$
- SSE measures the predicted value against the dependent values.
6. Describe $R^2$, including the Formula, Definition, Intuition, Application and Example.
$$ R^2=\frac{SST-SSE=SSR}{SST} $$
- Definition: R-squared is a measure that represents the proportion of the variance for a dependent variable that’s explained by the independent variable(s) in a regression model.
- Intuition: R-squared provides insight into how well the independent variable(s) in a regression model account for the variability in the dependent variable.
- Application: It used to test goodness of fit and be can used to compare with other model’s performance.
- Example: R-squared of 0.75, implies that 75% of the variation in the dependent variable can be explained by the independent variables.
7. What does a higher $R^2$ imply?
Classification
1. Explain the purpose of classification metrics.
2. Illustrate the confusion matrix and define the 4 quadrants.
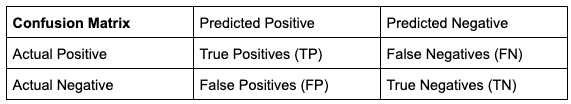
- True Positive - The prediction is positive and it is correct.
- False Positive - The prediction is positive but it is actually negative.
- True Negative - The prediction is negative and it is correct.
- False Negatives - The prediction is negative but it is actually positive.
3. Provide the formula for Accuracy and Error Rate. Explain when it is appropriate to use these metrics.
Intuition: % of the correction prediction (Correct Prediction/Total Prediction)
$\text{Accuracy Rate} = \frac{TP+TN}{TP+FN+FP+TN}$
$\text{Error Rate (1-Accuracy Rate)} = \frac{FP+FN}{TP+FN+FP+TN}$
It is appropriate to use these metrics when the target classes are well balanced, labels. For example, to classify if it’s cat or dog, need to have equal number of cats or dogs for accuracy or error rate to be useful.
4. Describe Recall, including the formula, definition, intuition, and an example.
$$ \text{Recall Rate} = \frac{TP}{TP+FN} = \frac{\text{True Positives}}{\text{All Actual Positives}} $$
- Definition: Ratio between true positive and all actual positives.
- Intuition: The ability to correctly identify all the actual positives (true positives and false negative). Recall attempts to answer “What proportion of actual positives was identified correctly?”
- Example: A recall of 11% implies that the model correctly identifies 11% of all the true positives.
5. Describe Precision, including the formula, definition, intuition, and an example.
$$ \text{Precision Rate} = \frac{TP}{TP+FP} = \frac{\text{True Positives}}{\text{All predicted positives}} $$
- Definition: Ratio between true positive and all predicted positives.
- Intuition: The ability to make correct predictions. Precision attempts to answer “What proportion of predicted positives are actually true positives?”
- Example: A precision of 0.5 implies that the model correctly predicts 50% of the time.
6. Explain recall and precision in terms of classifying the emails as spam.
- Recall is a measures the ability of the model to correctly identify all the actual spam emails.
- Precision is a measure of how many of the emails classified as spam by the model are actually spam.
7. Explain Precision and Recall trade off in the context of increasing the probability threshold.
Precision and Recall are inversely related because increasing the threshold increases false negative rate which will worsen recall and concurrently decrease false positive, which improves precision.
When threshold increases:
- false negative rate increases because the model has a higher chance of rejecting (classifying as negative) when it is actually positive.
- false positive rate decreases because the model is more stringent in approving (classifying as positive), making it more accurate in classifying the positive class.
8. State the statistical concept equivalent of false negative, false positive and probability threshold.
- False Negative: Type 2 Error.
- False Positive: Type 1 Error.
- Threshold: Significance Level.
Similar to increasing the probability threshold, increasing the significance level will lead to less false positive and more false negative.
9. Explain when to prioritise precision over recall and provide some examples.
Prioritise precision over recall when minimising false positive errors is more critical than capturing all positive instances.
Examples:
- Medical Treatment: False positives in this context could lead to unnecessary treatments or distress for patients.
- Legal Proceedings: False positives in this context could lead the incorrectly imprisoning innocent people.
10. Explain when to prioritise recall over precision and provide examples.
Prioritise recall over precision when it is more critical to capture all or most positive instances.
Examples:
- Medical Screening: Disease screening, such as mammography for breast cancer detection. In this case, missing a true positive (not detecting cancer when it’s present) can be devastating.
- Fraud Detection: It is better to flag more claims as positive (for further investigation) than to not detect it. That said, we should not allow too many false positives as it may harm user’s experience.
11. Explain the implications precision-recall trade off when the dataset is unbalanced and how to mitigate the issue.
If the dataset is unbalanced, the trade-off between precision and recall will be greater. Precision tends to be worse off because you’re more likely to get false positives due to lack of data to sufficiently train the dataset.
Mitigate this issue by:
- changing the threshold conditions
- balancing the dataset.
12. Describe F1 Score, including the formula, definition, intuition, and an example
$$ F_1 = 2 * \frac{P*R}{P+R} $$
- Definition: The F1 Score combines precision and recall into a single value. It provides a balance between these two metrics, allowing you to assess the model’s overall performance.
- Intuition: The ability correctly identify all the positive examples without making too many false positives.
- Example: A F1 score of 0.8 implies that the model is able to capture most of positive instances without making too many false positives.
13. What is the reason for using the harmonic mean instead of the arithmetic mean in the calculation of the F1 score?
The harmonic mean was used instead of simple average to reflect the importance of having good scores for both metrics by penalising extremely low values.
For example, when a model exhibits a precision of 1.0 and a recall of 0.0, the simple average of these values would be 0.5. However, the F1 score, which is 0 in this case, is more influenced by the lower of the two values.
Classification Intermediate
1. Describe false positive rates, including the Formula, definition and the intuition.
$\text{False Positive Rate = }\frac{FP}{FP+TN} = \frac{\text{False Positives}}{\text{All Actual Negatives}}$
- Definition: The ratio of false positives over all actual number negatives.
- Intuition: The False Positive Rate quantifies how often a model makes the mistake of labelling something as positive when it is actually negative.
2. Illustrate the Receiver Operating Characteristic-Area Under Curve (AUROC) and state the evaluated metric formulas.
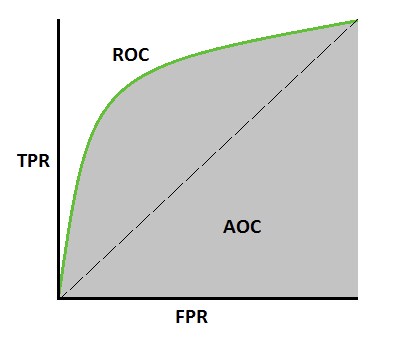
Image Source: https://towardsdatascience.com/how-to-evaluate-a-classification-machine-learning-model-d81901d491b1
$\text{False Positive Rate = }\frac{FP}{FP+TN} = \frac{\text{False Positives}}{\text{All Negatives}}$
$\text{True Positive Rate (Recall Rate)} = \frac{TP}{TP+FN} = \frac{\text{True Positives}}{\text{All Positives}}$
3. In AUROC, state the values of the metrics (TPR and FPR) when threshold is set to 0. Explain your answer.
4. Using AUROC, explaiIntermediate n how the values of the metrics (TPR and FPR) evolves with increasing thresholds.
As the threshold increases:
- The True Positive Rate (TPR) decreases because the higher rejection rate results in an increase in false negatives.
- The False Positive Rate (FPR) decreases because the higher rejection rate leads to a decrease in false positives.
5. State Youden’s J formula and provide the methodology to select the optimal threshold.
$J=\text{Sensitivity}+\text{Specificity}−1=TPR+TNR−1$
Optimal Threshold: Select the threshold that yields the highest J statistic value, which corresponds to the greatest gap between true positive rate (TPR) and false positive rate (FPR). A larger gap between TPR and FPR maximises the correct classification of positive cases while minimising false positives.
6. Interpret the AUROC scores [0, 0.5, 1].
- AUC = 1: Everything was classified correctly.
- AUC = 0.5: Model has no capacity to distinguish the classes
- AUC = 0: Everything was classified incorrectly.
7. Illustrate the precision-recall curve (AURPC) and list the evaluated metrics formulas.
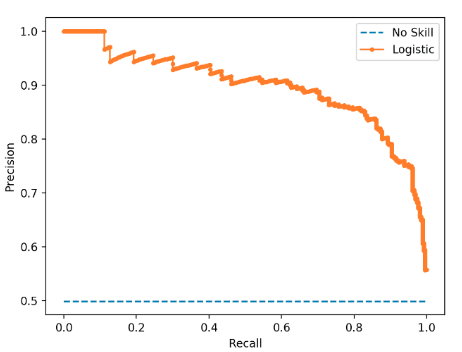
Image Source: https://machinelearningmastery.com/roc-curves-and-precision-recall-curves-for-imbalanced-classification/
$\text{Precision Rate} = \frac{TP}{TP+FP} = \frac{\text{True Positives}}{\text{All Predicted Positives}}$
$\text{ Recall Rate} = \frac{TP}{TP+FN} = \frac{\text{True Positives}}{\text{All Actual Positives}}$
8. What does the AUPRC convey?
9. State the values of the Recall and Precision metrics when threshold is set to 0. Explain your answer.
- Recall score = 1 because there are 0 false negatives.
- Precision score = 0 (close to 0) because there are a lot of false positives since everything will be classified as positive.
10. Describe how the values of the recall and precision evolves as the threshold increases.
As the threshold increases:
- recall decreases because there will be more false negatives.
- precision increases because there will be less false positives.